Voting Trends of the 2016
Presidential Election
Spatial Autocorrelation & Geostatistical Analysis
Applied GIS, Dr. David Baylis, University of Arkansas at Little Rock, April 1, 2020
Introduction
At the end of 2011, Barack Obama’s chance of winning the 2012 election looked bleak. His approval rating was down, economic growth was lacking, and unemployment remained high. However, despite the fact his prospects didn’t look great, Obama and his political advising team developed a political strategy that focused on healthcare and economic policies while criticizing his political opponent, Mitt Romney, for his stances on health care, tax cuts, women’s rights and equal pay. The strategy proved fruitful; Obama was able to bring together a diverse coalition of Americans and pulled off one of the most successful reelection campaigns winning the 2012 election.
In 2016, there was a major shift in the voting trend. Despite allegations of sexual misconduct, questionable business dealings, and racial discrimination, Donald Trump scored a shocking Electoral College victory that won him the 2016 election. Trump and Clinton are considered to be the least-popular nominees on record. Many voters disliked both candidates and opted not to vote at all. So, where did all the support for Trump come from?
Geospatial Analysis
The following maps show a geospatial analysis of the 2012 and 2016 elections. Figures 1 and 2 show an overall view of democratic support. Decline in Democratic support is shown in red and pink and an increase in Democratic support is shown in blue and purple.

Figure 1. Decline in Democratic support from 2012-2016 elections (red and pink).

Figure 2. Increase in Democratic support from 2012-2016 elections (blue and purple).
Spatial Autocorrelation
Figures 3 and 4 show areas of spatial autocorrelation: significant clustering where a county’s voting pattern is similar to neighboring counties. High-high values (blue) indicate regions that are of positive spatial autocorrelation meaning clustering is geographically significant and low-low values (red) indicate regions of negative spatial autocorrelation where clustering is not geographically significant.

Figure 3. 2012 Geographically significant clusters of Democratic voters in the 2012 election.

Figure 4. Geographically significant clusters of Democratic voters in the 2016 election.
LISA Scatter Plot
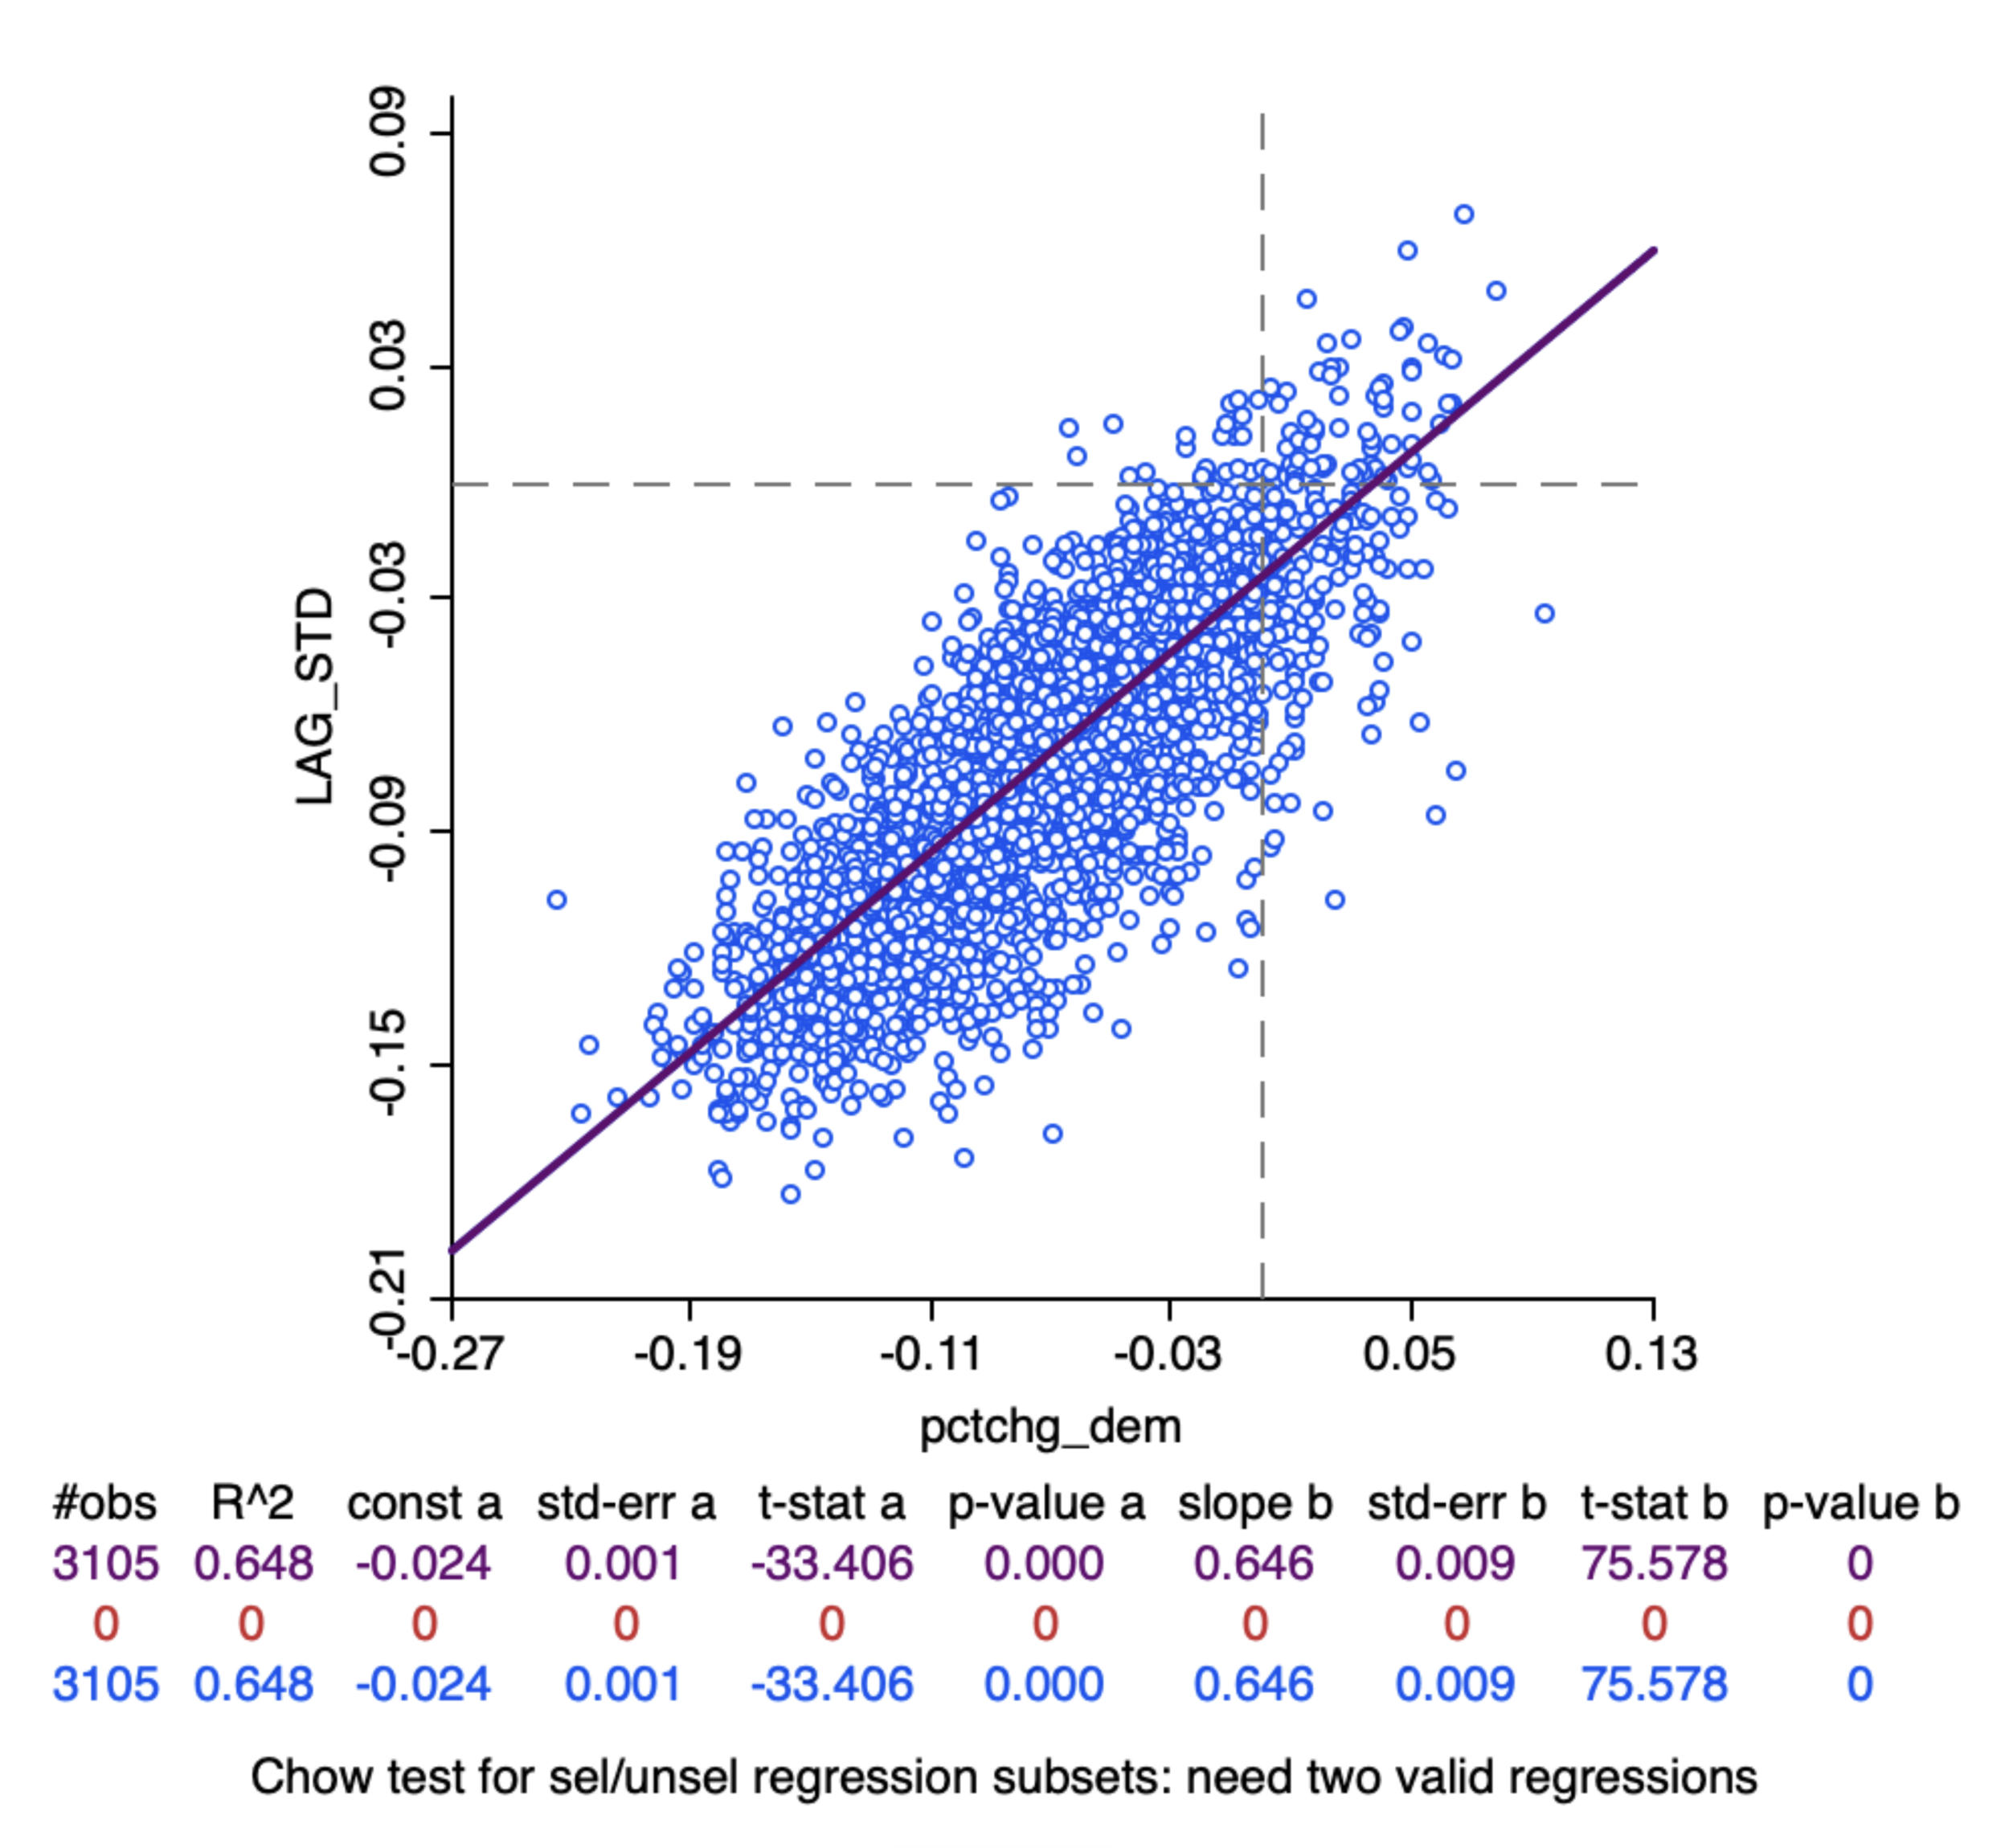
Figure 5. Change in vote share from 2012-2016.
Figure 5 is a directional LISA scatter plot of the change in Democratic vote share from 2012-2016. From these figures, we can see that there was a large decline in Democratic support between 2012 and 2016 particularly in the area of the Rust Belt, namely Iowa, Wisconsin, Michigan, Ohio, and Pennsylvania. There was also a small increase in Democratic support in southern California, Utah, and southern Texas.
Mapping Socioeconomic Factors
In order to understand the factors that may have contributed to the election of Donald Trump in 2016, we can map socioeconomic factors and compare them with areas of significant clustering. Figures 6 and 7 show a considerable decline in Democratic support among voters age 65+. Figures 8 and 9 show the decline in Democratic support among the percent of population with a median household income ranging from $20,000-$60,000. Lastly, Trump appears to have done very well among white voters.

Figures 6 and 7. Map and scatterplot showing the decline in Democratic support of the percent of population over the age of 65.


Figures 8 and 9. Map and scatterplot showing the decline in Democratic support of the percent of population with a median household income ranging from $20,000-$60,000.


Figures 10 and 11. Map and scatterplot showing the decline in Democratic support of the percent of population that is white/non-hispanic.

Discussion
If the Democrats wish to fare better in upcoming elections, they need to strengthen their appeal among voters in the Upper Midwest. Political scientists have found that people in rural areas feel as though they have been left behind by the urban elites, including government officials, and that jobs and opportunities are shifting elsewhere. The region was once the epicenter of the coal industry, steel production, and manufacturing, but has seen major economic decline accompanied by high poverty rates. With many blue collar jobs moving overseas, there is a desperate need to bring new jobs and new technologies to the area. Improved access to education and skills is greatly needed for continued economic growth in the region.